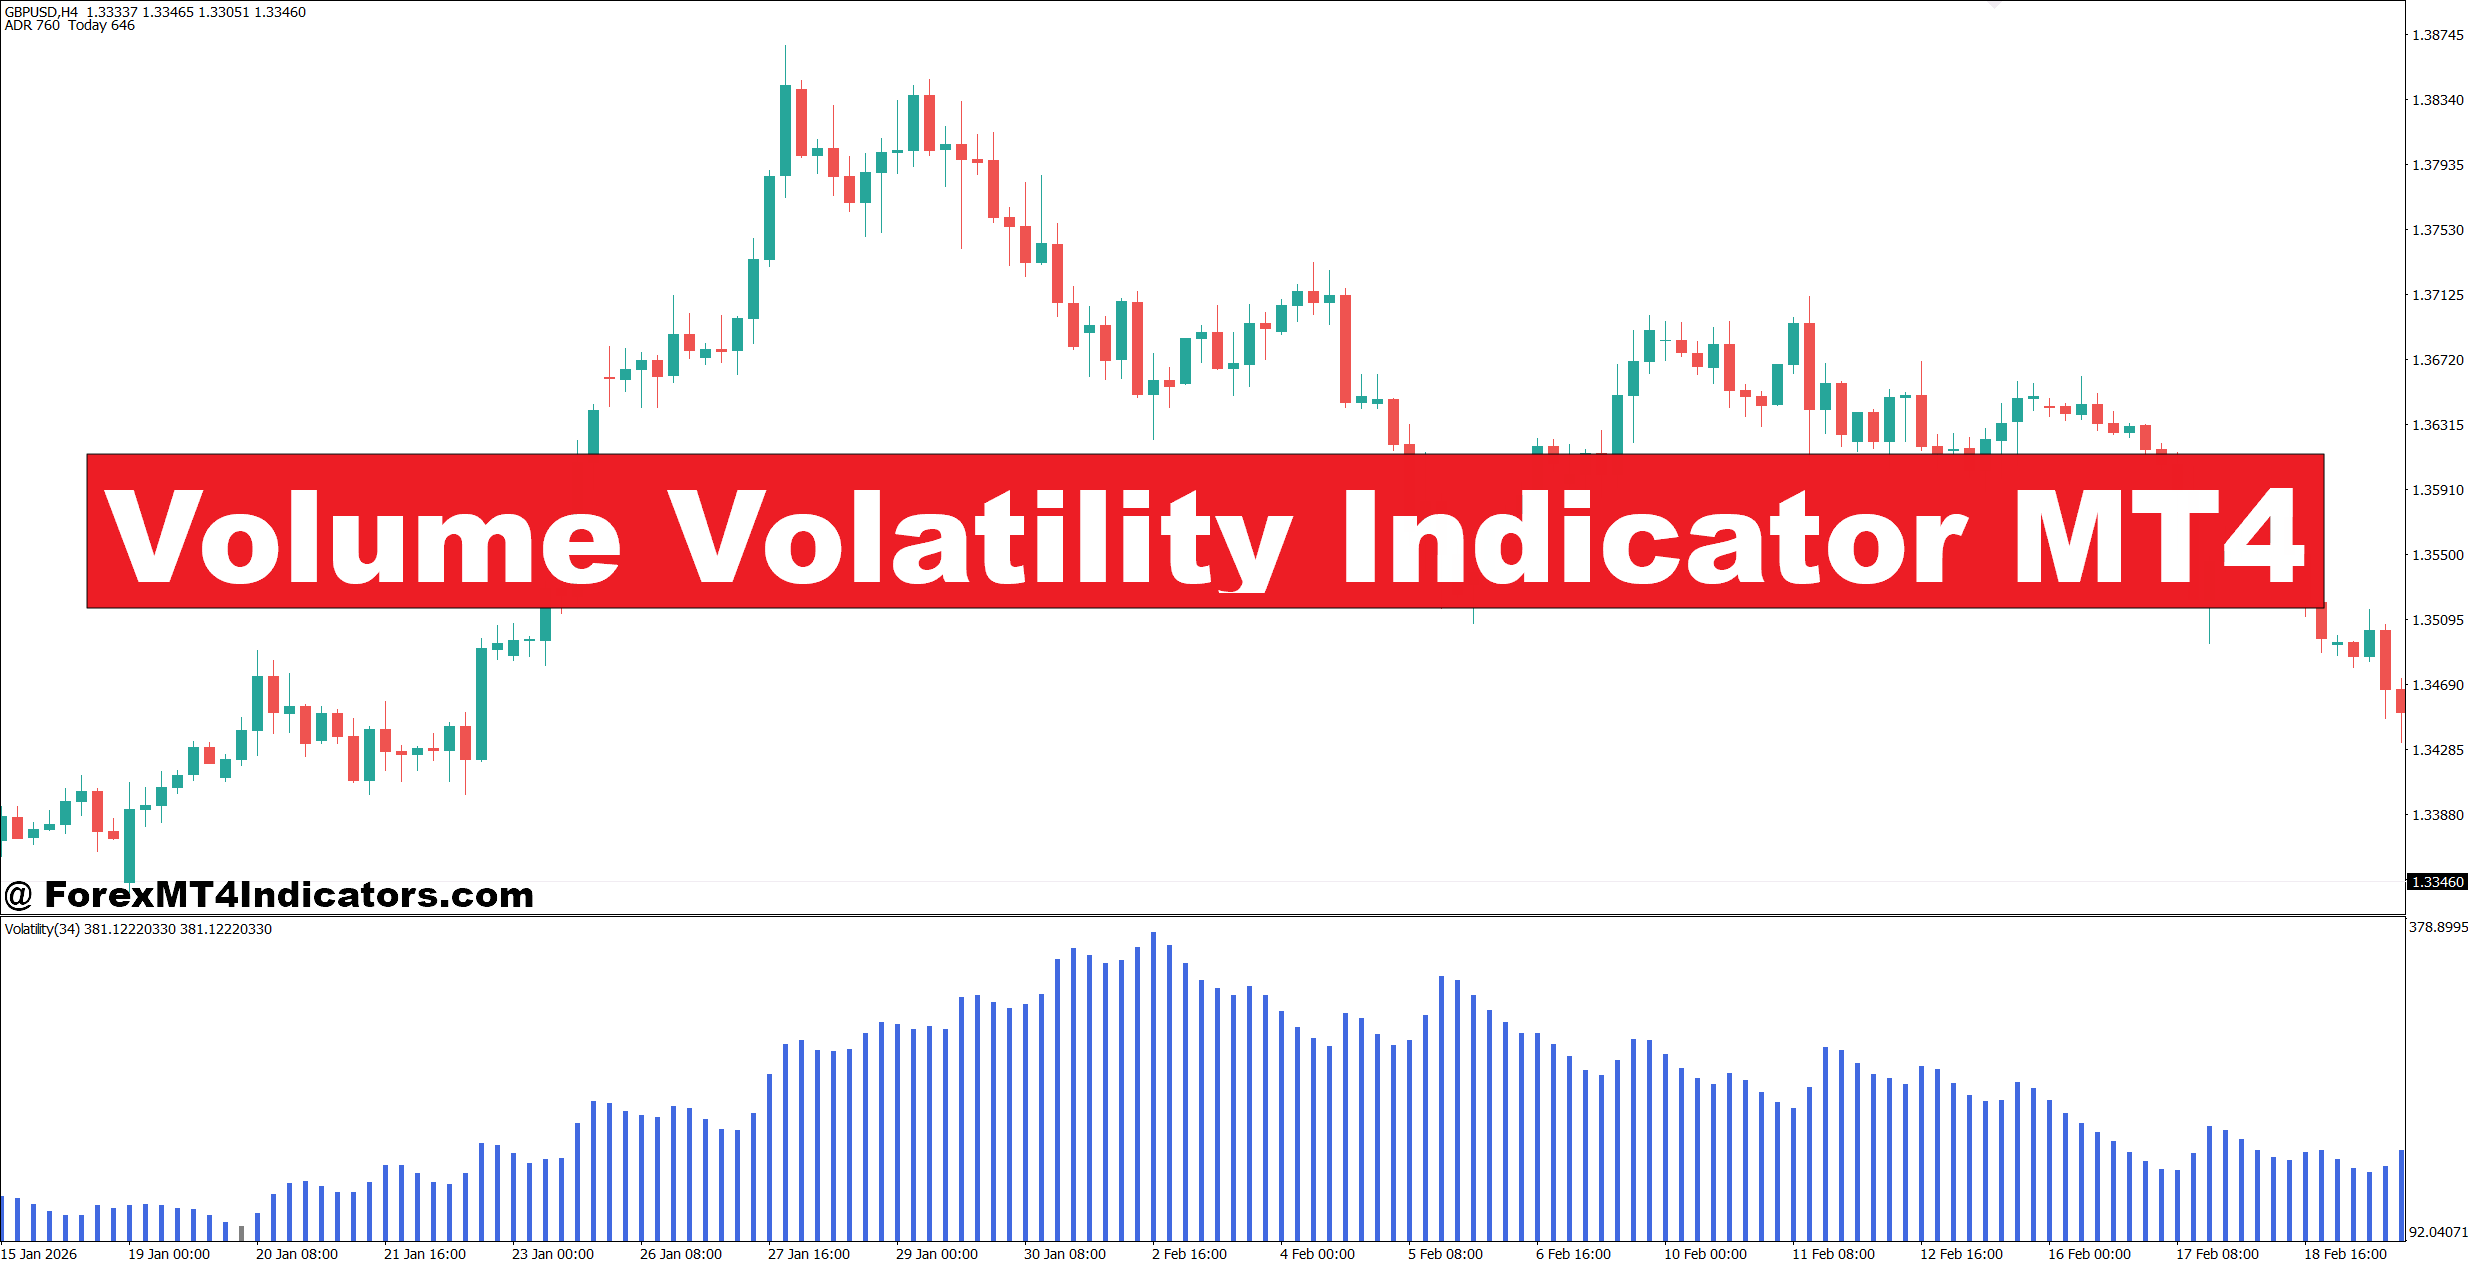
The Volume Volatility Indicator MT4 is a technical analysis tool designed to show changes in market activity and price volatility directly on an MT4 chart. Its exact calculation can vary between indicator versions, but the general idea is straightforward: compare recent trading activity and price movement with their normal range.
MT4 forex volume is usually tick volume rather than centralized exchange volume. Each tick represents a price update received by the platform. A rise in tick volume therefore suggests that market activity has increased, but it does not mean that the indicator knows the exact number of contracts traded across the entire forex market.
Many versions combine a volume average with a volatility measurement such as the Average True Range (ATR). For example, a 14-period ATR measures the average true range of recent candles, while a moving average of tick volume can show whether current activity is above or below its recent norm.
A trader might see EUR/USD produce an average 1-hour range of 7-9 pips during a quiet session. Then volume expands while the candle range jumps to 18 pips. That combination carries more weight than an 18-pip candle appearing with unusually low activity.
How Traders Read Volume and Volatility Together
The useful part isn’t simply seeing a high or low reading. The relationship between activity and price matters.
Suppose GBP/USD is approaching resistance at 1.2760 on the 1-hour chart. The pair has spent six candles moving sideways, with relatively low tick volume. Then price closes above 1.2760 with an 18-pip bullish candle, while the volume reading rises well above its recent average.
That can support a breakout setup. A trader could wait for a pullback toward 1.2760 instead of buying the first spike. If the former resistance holds as support and another bullish candle appears, the entry becomes more structured. A stop might sit 12-18 pips below the retest, depending on the pair’s current ATR and nearby market structure.
The opposite situation can also be useful. Imagine USD/JPY pushes 20 pips above resistance, but tick volume remains weak and the candle closes near its midpoint. That move deserves caution. It may be a liquidity sweep or simple fake-out rather than a sustained breakout.
Here’s the thing: high volume doesn’t automatically mean buy, and low volume doesn’t automatically mean sell. The indicator works better as confirmation than as a standalone signal generator.
Practical MT4 Trading Setups
One practical approach is to use the indicator with support and resistance on higher timeframes.
For a bullish setup, a trader could first identify support on the 4-hour chart. Then the 1-hour chart can be monitored for a bullish reaction near that level. If tick volume expands while the bullish candle closes strongly and volatility rises, the setup has stronger confirmation.
For example, EUR/USD may test 1.0820 support and bounce 15 pips. If the next 1-hour candle closes above its opening price with activity around 25% above the 20-period average, the trader could consider a long entry after confirmation. A 15-pip initial stop may be reasonable only if it sits outside the recent structure; otherwise, the stop needs more room.
The same logic works for short trades. If USD/CAD rejects 1.3650 resistance and selling activity increases, traders can wait for a bearish candle to close below a nearby intraday support level. A 20-30 pip target can then be compared with the stop distance before entering.
During major events such as NFP, CPI, or central-bank decisions, the indicator can become much more active. On an NFP release, EUR/USD might move 35-50 pips within a few minutes. That reading shows expansion, but entering immediately can expose the account to extreme spread widening and slippage. Waiting for the first reaction to settle is often safer than chasing the initial candle.
Settings for Different Timeframes and Pairs
There isn’t one perfect setting for every market. A parameter that works well on EUR/USD H1 may react too slowly on an M5 chart.
For H1 and H4 trading, a 14- or 20-period calculation can provide a reasonable view of recent activity. A 20-period volume average can also help identify whether current participation is unusually high or low.
On M5 or M15 charts, traders often need faster settings because market conditions can change within a few candles. A 10- or 14-period lookback may respond more quickly, although it can also produce more noise.
Major pairs such as EUR/USD and USD/JPY generally have strong liquidity. Exotic pairs can show wider spreads and less consistent activity, so volume readings should be interpreted with extra care.
A useful testing routine is to keep the default settings for at least 50-100 historical trades before making changes. Traders can then compare win rate, average reward-to-risk ratio, and false breakout frequency rather than adjusting parameters after every losing trade.
Strengths, Weaknesses, and Comparison With Other Indicators

The biggest advantage of a volume volatility indicator is context. Price tells traders where the market moved. Volatility shows how far it is moving. Tick volume adds information about activity behind that movement.
Compared with the 14-period RSI, this indicator focuses less on overbought and oversold conditions. RSI can remain above 70 during a strong trend, while volume and volatility can help identify whether that trend is still attracting activity.
Compared with the 14-period ATR, the volume component provides another dimension. ATR measures range but doesn’t tell traders whether tick activity is unusually strong. Combining both can help distinguish a normal price expansion from a move accompanied by increased market participation.
There are limits, though. Tick volume is broker-dependent and isn’t the same as centralized futures volume. The indicator can also spike during news releases without providing a reliable direction. In choppy markets, repeated activity surges may create several false signals.
Experienced traders generally avoid using one indicator as the reason for a trade. Market structure, trend direction, entry location, spread, and risk-to-reward still matter.
Trading forex carries substantial risk. No indicator guarantees profits. Traders should test the Volume Volatility Indicator MT4 on a demo account and avoid risking money they cannot afford to lose.
How to Trade with Volume Volatility Indicator MT4
Buy Entry

- Wait for Volume Expansion – Enter only when volume rises at least 20% above its 20-period average on the 1-hour chart.
- Confirm Bullish Breakout – Buy EUR/USD when price closes 5-10 pips above resistance with increased volatility.
- Check H4 Trend – Favor BUY signals when the 4-hour structure shows higher highs and higher lows.
- Use Support Retests – Buy GBP/USD after a bullish rejection from H1 support, ideally with a 10-20 pip rejection candle.
- Confirm Candle Strength – Look for a bullish candle closing near its high with volatility above its recent average.
- Set a Logical Stop – Place the stop 15-25 pips below support or the recent swing low, not at a random distance.
- Target 1:2 Risk-Reward – If the stop is 20 pips, aim for at least 40 pips of potential profit.
- Avoid Weak Signals – Don’t buy when volume falls 20% below average or when price is trapped in a tight sideways range.
Sell Entry

- Wait for Selling Activity – Consider SELL entries when volume rises 20% or more above its 20-period average.
- Confirm Resistance Break – Sell EUR/USD after a strong rejection from resistance followed by a 5-10 pip bearish move.
- Check H4 Structure – Prefer SELL setups when the 4-hour chart shows lower highs and lower lows.
- Use Resistance Retests – Sell GBP/USD after price retests broken H1 resistance and forms a bearish rejection candle.
- Watch Volatility Spikes – A sharp volatility increase with strong bearish price action can confirm downside momentum.
- Protect the Position – Use a 15-25 pip stop when market structure supports it, adjusting for current volatility.
- Keep Risk Below 1% – Risk no more than 1% of trading capital on a single setup, especially around major news.
- Skip Fake-Outs – Avoid SELL signals when volume is weak, price quickly reclaims resistance, or the daily trend remains strongly bullish.
Final Takeaway
The Volume Volatility Indicator MT4 can add useful context when traders need to judge whether a price move has meaningful activity behind it.
- Use activity as confirmation – A volume increase combined with expanding price range can strengthen a breakout or reversal setup.
- Respect market structure – Support, resistance, trend direction, and candle closes should remain part of the decision.
- Adjust settings carefully – H1 and H4 charts can tolerate slower calculations, while lower timeframes may require faster inputs.
- Avoid chasing spikes – News events can produce extreme readings, but the first move may be unstable and expensive to trade.
The indicator is best viewed as one piece of a larger trading plan, not a shortcut to predicting the next candle. Traders who combine it with disciplined entries, sensible stops, and controlled position sizing can make better-informed decisions without assuming every volume spike will lead to a profitable move.
Level up your trading
Learn to read the chart — not just the indicator
eBook · Instant PDF
The Candlestick Playbook
Read and trade 40+ candlestick patterns — with exact entries, stops and exits.
Video Course · 12 modules
The Price Action Masterclass
Read clean charts the no-indicator way — pin bars, support & resistance, entries and exits.
Recommended MT4/MT5 Brokers
XM
- ✓ *FREE *$50 to start (withdrawable)
- ✓ Deposit bonus up to $5,000
- ✓ Negative balance protection
Trading forex and CFDs carries a significant risk of loss and is not suitable for everyone. Broker links are affiliate links — we may earn a commission at no cost to you.
Free MT4 Indicator Download

Feed from Forexmt4indicators.com