
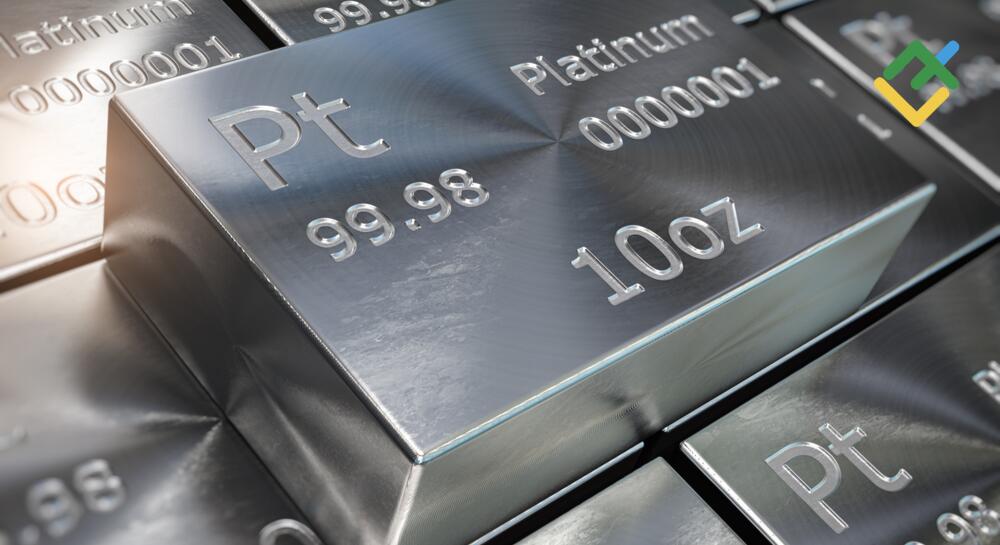

Platinum is a rare precious metal that is widely used not only in jewelry but also in the industrial sector. Around 44% of global demand comes from car manufacturers, who use platinum in the production of catalytic converters.
Since platinum is a commodity, investing in the XPTUSD pair requires a different approach than investing in traditional instruments such as stocks or bonds. The price of this precious metal is influenced by numerous factors, including the US Fed’s monetary policy, the global economic situation, and platinum mining rates. Read on to find out the potential trajectory of the XPTUSD exchange rate in 2026 and beyond.
The article covers the following subjects:
Major Takeaways
- The current XPT price is $1 620.02 as of 02.08.2026.
- The highest XPT price of $2920.41 was reached on 26.01.2026, while the all-time low of $562.25 was set on 16.03.2020.
- Some forecasts suggest that platinum could rise to $1,751.16 in the second half of 2026. More bearish projections, however, point to a decline toward $1,379.00–1,237.83.
- Most forecasts for 2027 are bullish. Some analysts expect platinum to rise to $2,008.47–2,051.00, while others believe it could reach $2,636.88.
- According to most forecasts, platinum prices will continue to rise between 2028 and 2030. More conservative estimates suggest a move to $2,011.51–2,445.34, while more optimistic analysts project prices climbing toward $3,958.65.
- Long-term forecasts are the least reliable, as it is impossible to predict all future fundamental factors and their impact on the market. Existing projections are based on historical data and generally remain positive about platinum’s long-term prospects. According to these forecasts, the metal could reach $6,197.00 by 2037 and $19,123.00 by 2050.
XPT Real-Time Market Status
The current XPT price is $1 620.02 as of 02.08.2026.
It is crucial to monitor the following parameters to assess the prospects of the precious metal:
- Year-over-Year Inflation Rate (US), determined based on the Consumer Price Index (CPI), which measures changes in the prices of goods and services.
- Interest Rate (US): The cost of borrowing funds, expressed as a percentage of the borrowed amount. It impacts investment and consumer spending.
- 52-Week Range: The highest and lowest prices of the asset over the past year.
- Trading Volume: A metric used in financial markets to track the total amount of trading activity.
- Yearly Change: The cumulative change in the asset’s price over the past year.
- Fear and Greed Index: A real-time indicator reflecting investor sentiment and expectations about the asset.
|
Indicator |
Value |
|
Year-over-year inflation rate (US) |
3.5% |
|
Interest rate (US) |
3.75% |
|
52-week range |
$1,259.65–2,923.66 |
|
Technical analysis signal |
neutral |
|
Yearly change |
15.80% |
XPT Price Forecast for 2026 Based on Technical Analysis
To forecast medium- and long-term XPTUSD movements, let’s analyze the asset’s weekly chart.
Since late June 2026, the asset has been consolidating within the 1,545.67–1,754.75 range. Technical indicators and candlestick patterns are sending mixed signals regarding platinum’s further movement:
- On the weekly chart, a large Bull Flag pattern (1) is taking shape. An upside breakout is expected above 1,754.75, with a target at 3,056.77 and potentially higher. The flag has been forming for five months and has already retraced 44% from its peak, which remains within the acceptable range for this pattern. A decline of more than 50% would invalidate the Bull Flag. Another noteworthy signal is the Bullish Counterattack candlestick pattern (2), which has formed near the key support level of 1,545.67. It suggests that buyers are attempting to reverse the trend and prevent any further decline. The Dragonfly Doji pattern (3) also points to growing bullish pressure.
- The MACD values are increasing in the negative zone, indicating weakening bearish momentum.
- The RSI is neutral, holding at 40. Further downside potential remains. However, the probability of a reversal from the lower boundary is increasing.
- The MFI is also declining, indicating capital outflows.
- The VWAP and SMA20 lines are above the market price, signaling ongoing selling pressure.
Below are the projected price levels for XPTUSD over the next 12 months:
|
Month |
Low, $ |
Average Price, $ |
High, $ |
|
August 2026 |
1,519.57 |
1,626.93 |
1,734.30 |
|
September 2026 |
1,720.59 |
1,809.68 |
1,898.77 |
|
October 2026 |
1,743.43 |
1,878.21 |
2,012.99 |
|
November 2026 |
1,848.51 |
1,974.15 |
2,099.79 |
|
December 2026 |
2,017.55 |
2,113.49 |
2,209.44 |
|
January 2027 |
1,985.57 |
2,138.62 |
2,291.67 |
|
February 2027 |
2,145.48 |
2,255.12 |
2,364.77 |
|
March 2027 |
2,287.10 |
2,380.76 |
2,474.42 |
|
April 2027 |
2,319.09 |
2,440.15 |
2,561.22 |
|
May 2027 |
2,424.16 |
2,556.65 |
2,689.15 |
|
June 2027 |
2,538.38 |
2,625.18 |
2,711.99 |
|
July 2027 |
2,675.44 |
2,755.39 |
2,835.34 |
Long-Term Trading Plan for XPTUSD for 2026
The technical analysis of the weekly XPTUSD chart has allowed us to identify key support and resistance levels that can be used in a trading strategy for the coming year.
Trading Plan for the Year
- The large Bull Flag pattern remains likely to play out in the near term.
- Key support levels: 1,545.67, 1,374.60, 1,260.55, 1,137.00, 1,018.20, 908.91, 818.63, 704.58.
- Key resistance levels: 1,754.75, 1,868.79, 2,025.61, 2,158.66, 2,291.71, 2,434.27, 2,557.82, 2,671.87, 2,819.17, 2,923.72, and 3,056.77.
- Main long-term scenario: Consider long positions above the key resistance level of 1,754.75 on increased trading volume, or following a price reversal from the 1,545.67 level, with potential targets at 1,868.79–3,056.77. Time frame: 12 months.
- Alternative long-term scenario: Consider short positions below the key support level of 1,545.67 on increased trading volume, with potential targets at 1,374.60–704.58.
Analysts’ XPT Price Projections for 2026
Bullish forecasts suggest that XPT could rise to $1,751.16 by the end of the year. The actual price action will depend on demand from the automotive industry and whether investors continue to see precious metals as safe-haven assets during economic and geopolitical uncertainty. The negative scenario suggests a decline to $1,379.00–1,237.83.
LongForecast
Price range (USD): 1,310.00–1,722.00.
According to LongForecast, the industrial metal could trade at 1,594.00 by the end of August. The asset is then expected to decline to 1,447.00 by the end of October and to 1,379.00 by year-end.
|
Month |
Low–High, $ |
Closing, $ |
|
August |
1,439.00–1,722.00 |
1,594.00 |
|
September |
1,420.00–1,594.00 |
1,495.00 |
|
October |
1,375.00–1,519.00 |
1,447.00 |
|
November |
1,397.00–1,544.00 |
1,470.00 |
|
December |
1,310.00–1,470.00 |
1,379.00 |
WalletInvestor
Price range (USD): 1,522.16–1,785.06.
WalletInvestor analysts remain bullish on platinum prices in the second half of 2026. They expect the metal to reach 1,636.60 by the end of August, before easing slightly to 1,616.19 by the end of October. By year-end, platinum is expected to recover to around 1,751.16.
|
Month |
Low, $ |
Average Price, $ |
High, $ |
|
August |
1,590.93 |
1,636.60 |
1,653.15 |
|
September |
1,522.16 |
1,542.29 |
1,659.06 |
|
October |
1,591.23 |
1,616.19 |
1,641.15 |
|
November |
1,700.66 |
1,746.62 |
1,777.21 |
|
December |
1,603.71 |
1,751.16 |
1,785.06 |
CoinCodex
Price range (USD): 1,120.10–1,322.82.
According to CoinCodex, XPTUSD is expected to average 1,280.75 by the end of August. The forecast then points to mixed price action, with the average price declining to 1,188.30 by the end of October before recovering to 1,237.83 by the end of December.
|
Month |
Low, $ |
Average Price, $ |
High, $ |
|
August |
1,236.60 |
1,280.75 |
1,322.82 |
|
September |
1,217.64 |
1,256.95 |
1,312.76 |
|
October |
1,120.10 |
1,188.30 |
1,241.84 |
|
November |
1,184.61 |
1,215.22 |
1,239.59 |
|
December |
1,230.20 |
1,237.83 |
1,250.41 |
Analysts’ XPT Price Projections for 2027
Forecasts for 2027 are more mixed. According to various forecasts, platinum could reach $2,008.47–2,051.00 by year-end. A wider adoption of green hydrogen technologies, which use platinum in electrolyzers, and supply constraints in key producing regions such as South Africa may support further price growth. A more optimistic scenario suggests a rise to $2,636.88.
Note: The price ranges reflect the asset's expected volatility throughout the year. Lows and highs may not be shown in the summary tables.
LongForecast
Price range (USD): 1,379.00–2,154.00.
LongForecast analysts expect mixed price action for the industrial metal in 2027. The price is forecast to stabilize at 1,640.00 by the end of the first quarter. It could then rise to 1,803.00 during the first half of the year, with further gains expected through year-end. According to the forecast, the price is expected to close the year at 2,051.00.
|
Quarter |
Low–High, $ |
Closing, $ |
|
Q1 |
1,379.00–1,722.00 |
1,640.00 |
|
Q2 |
1,613.00–1,893.00 |
1,803.00 |
|
Q3 |
1,724.00–2,024.00 |
1,928.00 |
|
Q4 |
1,834.00–2,154.00 |
2,051.00 |
WalletInvestor
Price range (USD): 1,601.20–2,118.22.
According to WalletInvestor, platinum is expected to average 1,851.98 by the end of the first quarter of 2027. The average price is then forecast to rise to 1,898.60 in the second quarter. Analysts expect the uptrend to continue through year-end, with the price reaching 2,008.47.
|
Quarter |
Low, $ |
Average Price, $ |
High, $ |
|
Q1 |
1,636.71 |
1,851.98 |
1,895.22 |
|
Q2 |
1,601.20 |
1,898.60 |
1,952.89 |
|
Q3 |
1,657.67 |
1,868.03 |
1,927.75 |
|
Q4 |
1,890.08 |
2,008.47 |
2,118.22 |
CoinCodex
Price range (USD): 2,359.28–5,151.29.
According to CoinCodex, XPT is expected to stabilize at 1,378.35 in the first quarter of 2027. The price is then forecast to trade within a wide range of 1,502.79–4,467.82, with a June closing price of 3,265.49. In the third quarter, the price is expected to decline to 2,853.77, followed by a further decline to 2,636.88 in the fourth quarter.
|
Quarter |
Low, $ |
Average Price, $ |
High, $ |
|
Q1 |
1,248.03 |
1,378.35 |
1,536.18 |
|
Q2 |
1,502.79 |
3,265.49 |
4,467.82 |
|
Q3 |
2,577.31 |
2,853.77 |
3,731.10 |
|
Q4 |
2,191.03 |
2,636.88 |
2,996.71 |
Analysts’ XPT Price Projections for 2028
The consensus forecast for 2028 points to neutral price action in platinum. The metal is expected to test the $1,756.03–1,983.00 range. Growing investment in low-carbon technologies and possible tighter environmental standards for heavy transport may support demand. Under a more bullish scenario, platinum could rise to $2,334.92.
LongForecast
Price range (USD): 1,657.00–2,145.00.
Experts from LongForecast anticipate mixed price action for the trading instrument in 2028. The price could stabilize at 1,916.00 by the end of the first quarter before rising to 1,959.00 by the end of the first half of the year. It is then forecast to decline to 1,744.00 in the third quarter before recovering to 1,983.00 in the fourth quarter.
|
Quarter |
Low–High, $ |
Closing, $ |
|
Q1 |
1,820.00–2,145.00 |
1,916.00 |
|
Q2 |
1,737.00–2,057.00 |
1,959.00 |
|
Q3 |
1,657.00–1,959.00 |
1,744.00 |
|
Q4 |
1,744.00–2,082.00 |
1,983.00 |
WalletInvestor
Price range (USD): 1,779.56–2,440.49.
According to WalletInvestor, platinum is expected to average 2,039.94 in the first quarter of 2028. The average price is then forecast to decline to 1,953.84 by mid-year before rising to 2,334.92 by year-end.
|
Quarter |
Low, $ |
Average Price, $ |
High, $ |
|
Q1 |
1,849.64 |
2,039.94 |
2,300.84 |
|
Q2 |
1,779.56 |
1,953.84 |
2,032.86 |
|
Q3 |
1,894.53 |
2,066.53 |
2,155.17 |
|
Q4 |
2,000.41 |
2,334.92 |
2,440.49 |
CoinCodex
Price range (USD): 1,539.83–2,983.19.
According to CoinCodex, the industrial metal is expected to trade at 2,680.53 in the first quarter of 2028. The price could then decline to around 2,065.86 by mid-year. Further downside is expected in the third and fourth quarters, with the price falling to 1,756.03.
|
Quarter |
Low, $ |
Average Price, $ |
High, $ |
|
Q1 |
2,399.20 |
2,680.53 |
2,983.19 |
|
Q2 |
1,913.52 |
2,065.86 |
2,539.99 |
|
Q3 |
1,543.00 |
1,816.88 |
2,252.25 |
|
Q4 |
1,539.83 |
1,756.03 |
1,834.82 |
Analysts’ XPT Price Projections for 2029
Forecasts for 2029 point to mixed price action. While some analysts expect platinum to consolidate within the $1,892.00–2,245.05 range, others forecast a decline to $1,486.98. By then, hydrogen economy supply chains could enter the commercialization stage, potentially creating a structural deficit in the platinum market.
LongForecast
Price range (USD): 1,616.00–2,030.00.
According to LongForecast, the asset is expected to reach 1,881.00 by the end of the first quarter of 2029. The price is then forecast to decline through the first half of the year, reaching 1,800.00 by the end of June. A recovery to 1,892.00 is expected in the third and fourth quarters.
|
Quarter |
Low–High, $ |
Closing, $ |
|
Q1 |
1,682.00–1,983.00 |
1,881.00 |
|
Q2 |
1,710.00–2,015.00 |
1,800.00 |
|
Q3 |
1,722.00–2,030.00 |
1,813.00 |
|
Q4 |
1,616.00–1,987.00 |
1,892.00 |
WalletInvestor
Price range (USD): 1,376.41–2,324.25.
According to WalletInvestor, the trading instrument is expected to see bearish price action in 2029. Platinum is forecast to stabilize at 2,072.70 by the end of the first quarter. The price could then decline to 1,998.91 by mid-year before falling to 1,486.98 by year-end.
|
Quarter |
Low, $ |
Average Price, $ |
High, $ |
|
Q1 |
1,915.88 |
2,072.70 |
2,267.51 |
|
Q2 |
1,706.58 |
1,998.91 |
2,097.92 |
|
Q3 |
1,665.85 |
1,756.40 |
2,324.25 |
|
Q4 |
1,376.41 |
1,486.98 |
1,746.34 |
CoinCodex
Price range (USD): 1,590.75–2,366.38.
According to CoinCodex, the asset is expected to trade around 1,635.93 by the end of the first quarter of 2029. The price of platinum could then rise to around 1,718.80 by mid-year before increasing to 2,245.05 by year-end.
|
Quarter |
Low, $ |
Average Price, $ |
High, $ |
|
Q1 |
1,597.42 |
1,635.93 |
1,718.71 |
|
Q2 |
1,590.75 |
1,718.80 |
1,854.60 |
|
Q3 |
1,617.70 |
1,896.63 |
2,305.36 |
|
Q4 |
1,912.30 |
2,245.05 |
2,366.38 |
Analysts’ XPT Price Projections for 2030
Analysts expect platinum to reach $2,011.51–2,445.34 by the end of the decade. A more bullish forecast points to a rise to $3,958.65. Two factors may drive this growth: wider adoption of hydrogen energy and limited supply from new large deposits. Volatility is likely to remain elevated, although the broader trend is expected to stay positive.
WalletInvestor
Price range (USD): 1,400.66–2,596.18.
According to WalletInvestor, the price of the industrial metal is expected to reach 1,643.75 by the end of the first quarter of 2030. The price is then forecast to rise to 1,818.48 by mid-year before stabilizing at 2,445.34 by the end of December.
|
Quarter |
Low, $ |
Average Price, $ |
High, $ |
|
Q1 |
1,400.66 |
1,643.75 |
1,735.28 |
|
Q2 |
1,593.04 |
1,818.48 |
1,923.02 |
|
Q3 |
1,814.10 |
2,175.41 |
2,461.81 |
|
Q4 |
2,105.02 |
2,445.34 |
2,596.18 |
Gov Capital
Price range (USD): 1,372.22–2,343.80.
According to Gov Capital, the average price is expected to reach 1,602.23 in the first quarter of 2030. The average price of the industrial metal could then rise to 1,700.38 by mid-year. The bullish rally is expected to continue thereafter, with the average price climbing to 2,011.51. The annual high is forecast at 2,343.80 in December.
|
Quarter |
Low, $ |
Average Price, $ |
High, $ |
|
Q1 |
1,372.22 |
1,602.23 |
1,762.46 |
|
Q2 |
1,436.92 |
1,700.38 |
1,871.93 |
|
Q3 |
1,502.68 |
1,938.57 |
2,132.43 |
|
Q4 |
1,728.38 |
2,011.51 |
2,343.80 |
CoinCodex
Price range (USD): 2,084.47–4,604.13.
According to CoinCodex, XPTUSD is expected to stabilize at 2,225.28 at the beginning of 2030. The price is then forecast to rise throughout the second quarter, reaching 2,719.92 by the end of June. Bullish momentum is expected to continue in the second half of the year, with the price climbing to 3,958.65 by the end of December.
|
Quarter |
Low, $ |
Average Price, $ |
High, $ |
|
Q1 |
2,084.47 |
2,225.28 |
2,290.40 |
|
Q2 |
2,233.64 |
2,719.92 |
3,275.39 |
|
Q3 |
2,776.11 |
2,910.30 |
3,303.36 |
|
Q4 |
2,973.46 |
3,958.65 |
4,604.13 |
Analysts’ XPT Price Projections up to 2050
Making forecasts for platinum prices for 2040–2050 involves a high degree of uncertainty due to unpredictable technological breakthroughs, such as the potential replacement of platinum in catalysts, geopolitical shifts, and the long-term impact of climate policy.
However, reviewing expert opinions helps identify key global trends, including the energy transition, changes in the industrial landscape, and reserve dynamics. Building these scenarios into an investment strategy allows investors to assess long-term risks and potential returns, determine the appropriate portfolio allocation, and make a flexible plan that can adapt to new data.
According to Coin Price Forecast, platinum could reach $5,110.00 by the end of 2033. Between 2032 and 2035, the firm expects the bullish rally to continue toward $5,701.00. By 2037, platinum is projected to rise to $6,197.00.
According to CoinCodex, platinum could climb to $7,122.67 by 2040. The firm’s analysts also expect the metal to reach $19,123.00 by 2050.
|
Year |
Coin Price Forecast, $ |
CoinCodex, $ |
|
2033 |
5,110.00 |
– |
|
2035 |
5,701.00 |
– |
|
2040 |
– |
7,122.67 |
|
2050 |
– |
19,123.00 |
XPT (Platinum) Market Sentiment on Social Media
Media sentiment reflects the collective expectations of traders and investors expressed in posts and comments on social media. Analyzing these views helps forecast XPTUSD price movements, as positive commentary often precedes gains, while negative sentiment may signal weakening demand for platinum.
For example, X user @i_durann expects platinum to decline further toward $1,538.00–1,478.00 if the price establishes itself below $1,590.00.
By contrast, independent trader @UygarAynur forecasts XPTUSD to rise to $1,757.00–1,960.00 and beyond, provided bulls hold the key support level at $1,512.00.
Meanwhile, @prsyndicate001 points to increasing buying pressure and expects the price to climb toward $1,619.33–1,676.65 in the near term.
Overall, sentiment on X suggests that many traders and investors remain optimistic about platinum’s price outlook.
XPT Price History
Platinum hit its all-time high of $2920.41 on 26.01.2026.
The lowest XPT price of $562.25 was set on 16.03.2020.
It is essential to evaluate historical data to make predictions as accurate as possible. The chart below shows the XPTUSD pair’s performance over the last ten years.
At the beginning of 2020, platinum demand fell sharply amid the COVID-19 pandemic, pushing prices down to $561.01. By the end of 2020, however, prices began to recover, supported by expectations of a global economic rebound and promising developments in hydrogen technologies.
Between 2021 and 2025, platinum traded within a wide range of $822.59–$1,317.41, reacting primarily to macroeconomic factors and geopolitical risks.
From May to December 2025, prices rose sharply, reaching $2,421.59, driven by heightened geopolitical tensions, high inflation, a weaker US dollar, and strong industrial demand.
At the end of January, platinum reached a record high of $2,920.55. It then entered a prolonged downtrend, falling to $1,626.45 by the end of July. The decline was driven by the US-Iran conflict in the Middle East, rising inflation, and the Federal Reserve’s increasingly hawkish monetary policy stance.
XPT Fundamental Analysis
Analyzing the fundamental factors that influence the value of XPTUSD plays a crucial role in forecasting future prices. This provides a comprehensive view of market conditions, helping traders make more informed decisions.
Key Factors Influencing XPT’s Price
- Demand and Supply. The balance between industrial demand (automotive industry, electronics, chemical industry) and supply from mines in South Africa, Russia, and other producing countries.
- Geopolitical Factors. Political risks in producing countries, sanctions, and trade wars.
- Economic Stability. The state of the global economy, inflation, and interest rates.
- Currency Exchange Rates. The relationship between the U.S. dollar (the primary currency for platinum trading) and the currencies of producing countries.
- Technological Innovations. The development of new technologies that reduce the need for platinum.
- Investment Demand. Interest from institutional investors and individuals.
- Automotive Standards. Stricter environmental regulations that encourage the use of platinum in catalytic converters.
- Platinum Inventories. The level of reserves held by producers and consumers.
- Prices of Other Metals. The cost of palladium, rhodium, and gold, which can serve as alternatives to platinum.
- Energy Crisis. The impact of electricity prices on platinum production.
More Facts About XPT
Platinum is the third most popular precious metal. When investing in this type of asset, a number of features should be taken into account:
- South Africa is the world’s major platinum miner, accounting for approximately 70% of the global reserves. Consequently, production levels are heavily influenced by the region’s geopolitical and macroeconomic conditions.
- Platinum serves as both an industrial and jewelry commodity, with the automotive sector driving most of the global demand, accounting for 44% of production. Meanwhile, the creation of ingots and coins makes up around 10%–15% of the market.
- Platinum is less liquid in the market than gold and silver due to low investor demand.
The development of green energy has a mixed impact on the use of platinum in manufacturing. On the one hand, the precious metal is used in the production of catalysts for diesel cars. On the other hand, the shift to electric vehicles, which do not require these catalysts, is pushing diesel and petrol engines out of the market. However, hydrogen energy, which is rapidly advancing, is closely tied to platinum. Consequently, the future demand for platinum will largely hinge on the development of green energy.
The jewelry industry is the second-largest sector in terms of consumption, representing nearly one-third of the total platinum supply. The main target market for jewelry made from this precious metal is China.
First and foremost, platinum is an excellent tool for diversifying your investment portfolio, helping to mitigate risks associated with other assets. Platinum began to gain recognition as an investment asset in the second half of the 20th century. Nowadays, there are many ways to invest in this asset:
- Buying shares in an ETF (exchange-traded investment fund) with net assets consisting of ingots;
- Buying physical metal, such as platinum ingots and coins;
- Buying the precious metal by opening an unallocated metal account in banks;
- Use of complex derivative instruments, like futures or CFDs, for speculation on the financial market;
- Investing in shares of public companies engaged in the exploration and mining of precious metals, including platinum.
Advantages and Disadvantages of Investing in XPT
This section explores the advantages and disadvantages of investing in platinum.
Advantages
- Industrial Importance of the Precious Metal. Platinum plays a significant role in the automotive industry and the emerging hydrogen energy sector. This can contribute to stable growth in investor interest.
- Diversification of the Investment Portfolio. Adding platinum to your investment portfolio helps hedge risks from declines in other assets.
- Undervaluation of Platinum and Growth Potential. Current platinum prices are lower compared to historical averages. This could lead to price increases if demand rises or supply decreases in the market.
Disadvantages
- Lack of Regular Income Like Dividends or Interest from Deposits. This means that to generate profit, you need to sell part or all of your assets.
- Volatility. Due to lower interest from market participants, platinum’s volatility is generally lower than that of gold or silver. However, in some cases, platinum prices can be more volatile due to industrial demand for the metal.
- VAT Taxation. Unlike gold, platinum is subject to value-added tax, which can negatively impact the overall profitability of your investments. An exception is when platinum is stored in offshore locations or customs warehouses.
How We Make Forecasts
To forecast the price of platinum, we use a comprehensive approach.
1. Fundamental analysis includes:
- Analysis and evaluation of forecasts from major analytical agencies;
- Analysis of supply and demand in the platinum market;
- Monitoring the exchange rates of the U.S. dollar, South African rand, and currencies of platinum-producing countries;
- Assessment of progress in green energy and its development prospects (innovation adoption, development of new products, etc.);
- Evaluation of news related to the precious metal;
- Assessment of geopolitical and macroeconomic factors affecting the metal’s value.
2. Analysis of market sentiment and social media trends.
3. Technical analysis includes:
- Evaluation of technical indicators to track current trends, their strength, and identify potential buying/selling zones;
- Analysis of candlestick and chart patterns to predict changes in the precious metals market in advance.
The combination of these methods allows us to identify current market sentiment, enter trades at the most favorable prices, and set trading and investment goals in advance.
Conclusion: Is XPT a Good Investment?
Investing in platinum involves carefully balancing risk against potential returns. In the long term, the metal appears promising due to its essential role in the automotive sector and its growing use in green technologies. Moreover, global supply is gradually declining. Together, these factors create a strong foundation that could support future price growth.
However, this asset is highly volatile, with its price strongly influenced by the automotive production cycle and conditions in the precious metals market. XPT can be a valuable addition to a long-term diversified portfolio, while its high volatility also makes it attractive for short-term trading. Nevertheless, before making any trading or investment decisions, it is essential to conduct thorough analysis and carefully review relevant news and expert insights.
XPTUSD Price Prediction FAQ
Price chart of XPTUSD in real time mode
The content of this article reflects the author’s opinion and does not necessarily reflect the official position of LiteFinance broker. The material published on this page is provided for informational purposes only and should not be considered as the provision of investment advice for the purposes of Directive 2014/65/EU.
According to copyright law, this article is considered intellectual property, which includes a prohibition on copying and distributing it without consent.
Feed from Litefinance.com